Status
The Status tab provides a high level overview of your ClickRight Network as well as any upload activity occurring on the current device. On the left side of the page is a list of devices in your ClickRight Cloud including the amount of data stored on each device. In the main window, you can view the 'Queue' of the folders and/or files that are uploading as well as a 'Log' or history of activity. Below the device list is the Network Health meter which measures the latency of your network connection (described in more detail below).
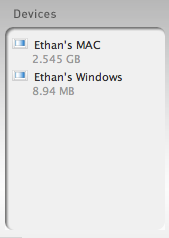 |
Devices - A list of the devices in your ClickRight Network as well as the amount of data stored on each device. |
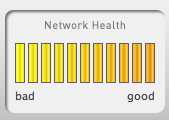 |
Network Health - The Network Health meter measures the responsiveness of your current network connection (or - in technical terms - your network latency). NOTE: This is not a measure of throughput but purely the response time of your current network connection. |
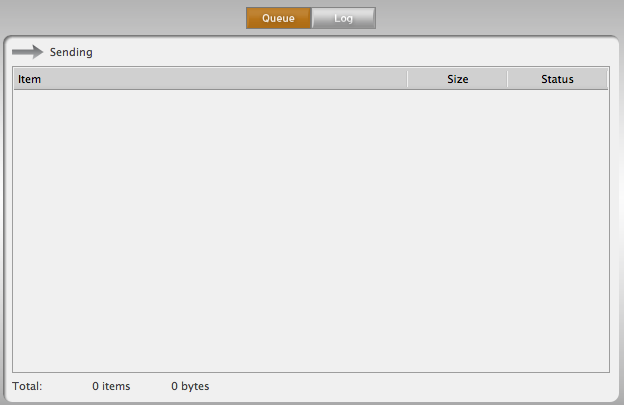 |
Queue - The 'Queue' allows you to see in real-time what data is being uploaded (sent) to the ClickRight Cloud. If an Internet connection times out or your computer goes to sleep, you can always refer back to this page to see the exact status of any folder or file in the upload process. |
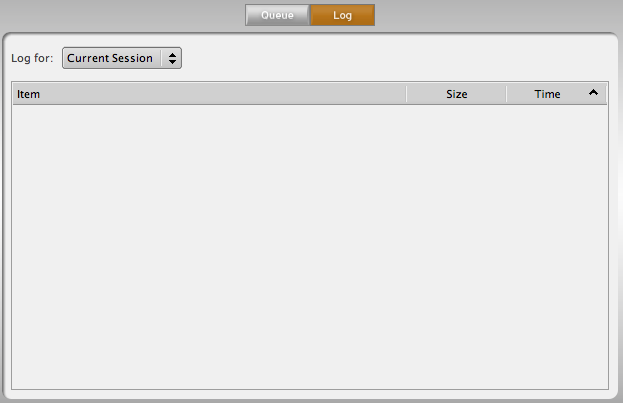 |
Log - The 'Log' provides a historical perspective on the upload processes - allowing you to observe the date and time folders and/or files have been sent to the ClickRight Cloud. |